Funsize fun times
It starts with a simple goal - a release should take less time. Before we can make it faster, we have to know how much time it takes at the moment. If we focus on the release automation, there's a good first candidate to investigate, because it runs on every platform and every locale, and takes a long time: partial update generation.
A partial update is a way of making the files needed for a software upgrade smaller. They contain only the differences between a specific older version and the new one. Because of this, we need to spend some time generating these differences from a set of older versions, as those will be different for each one.
Because the file format in use is the MAR (Mozilla ARchive), the task to make MARs smaller has often been called funsize.
How much quicker?
If we want to go faster, we need to know how fast we're doing things at the moment. Data available from Taskcluster allows us to get the start and finish time of the relevant tasks, but that's not very fine-grained, and doesn't necessarily help us find out which components can be improved.
For example, using the taskcluster data, we can get the average task duration for a particular day.
| Platform | Mean Duration | Task Count |
|---|---|---|
| windows2012-64 | 14m53s | 102 |
| windows2012-32 | 13m41s | 102 |
| linux64 | 17m11s | 102 |
| linux32 | 13m18s | 102 |
| OSX | 19m14s | 102 |
Inside an individual task, there are four different partials to generate, simply by task chunking. Each one does the following:
- Download the 'from' and 'to' MAR files
- Unpack both
- Virus scan both
- Performing the binary diff checks and storing patch files
That's some network downloads, file operations and CPU-bound operations that we don't have insight into.
Let's add some data collection.
Finding out how long things take
Some of our operations groups use Datadog to collect information about services. Rather than reinvent that wheel, let's send our own data into that, too. Datadog even has a Python library. We just need an API key. We also need the code to continue working if no API key is set, which we can easily do because a ThreadStats object is valid even if you don't call initialize or start on it: the metrics just don't go anywhere. This lets us use it throughout the code without explicitly checking that we want to collect metrics each time.
from datadog import initialize, ThreadStats
ddstats = ThreadStats(namespace='releng.releases.partials')

if dd_api_key:
    dd_options = {
        'api_key': dd_api_key,
    }
    log.info("Starting metric collection")
    initialize(**dd_options)
    ddstats.start(flush_interval=1)
else:
    log.info("No metric collection")
Here, we choose a sensible namespace for our metrics. It's not just us collecting metrics, so we want to make sure we don't scribble over someone else's data. We're 'release engineering', this is release automation, and we're in a component that's about generating partial updates, so 'releng.releases.partials' seems appropriate. Using the namespace here means we don't have to have this set for each individual metric submitted using this instance of ThreadStats. If we collect 'duration' later on then 'releng.releases.partials.duration' will be the metric name submitted.
Now that's set up, we can add timers to the parts of the code that we suspect might be taking a while. For example, we use the sh module to run clamscan on our unpacked directories, so we can easily replace
sh.clamscan("-r", unpack_dir, _timeout=600, _err_to_out=True)
with
with ddstats.timer('mar.clamscan.time'):
    sh.clamscan("-r", unpack_dir, _timeout=600, _err_to_out=True)
This isn't quite enough, though. We should be tagging our metrics so that we can find out more information about them when looking at the data later. In an effort to be a tiny bit more like Metrics 2.0, we add a note about the platform, so we can tell if the time taken to scan files depends on the architecture they're built for.
metric_tags = [
    "platform:{}".format(platform),
]
with ddstats.timer('mar.clamscan.time', tags=metric_tags):
    sh.clamscan("-r", unpack_dir, _timeout=600, _err_to_out=True)
Let's be careful not to add too many tags, as increasing the cardinality of a metric has performance and storage consequences.
We can also add timers to other important calls
metric_tags = [
    "branch:{}".format(mar_data['branch']),
    "platform:{}".format(mar_data['platform']),
]

with ddstats.timer('generate_partial.time', tags=metric_tags):
    generate_partial(work_env, from_path, path, dest_mar, ...)
And record some potentially useful data that won't fit nicely in tags, but is still related
metric_tags.append("unit:bytes")
# Allows us to find out how many releases there were between 'from' and 'to'
metric_tags.append("update_number:{}".format(mar_data.get('update_number', 0)))
ddstats.gauge('partial_mar_size', mar_data['size'], tags=metric_tags)
What do we find out from this data?
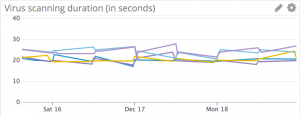
Virus Scans
Our virus scanning times look stable. The graph is a bit choppy because we run the nightly releases once a day, so there's not a continuous stream of data coming in.
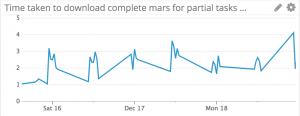
Download Times
The graph of download times is a good example of what happens when you don't add useful tags to your metrics. Here we would benefit from knowing which platforms we were downloading files for, as that would likely explain the uneven nature of the data. However, the times are mostly short. We could save some time in the future by downloading files in parallel, but only a small amount.
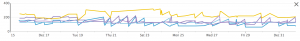
Partials generation
As expected, generating the partial files themselves takes the majority of the time. This time, the metric tags show us something useful: There's a marked difference in timing between the platforms with MacOSX (yellow) taking longer than Linux (purple 32bit and 64bit), which in turn is longer than Windows (Blue 32bit and 64bit).

What a diff-erence a patch makes
The heavy lifting in making a partial update is done by mbsdiff. This is a locally modified version of the binary diff bsdiff algorithm by Colin Percival. We could have guessed this was the part taking most of the time, but it's good to have confirmation because the world - and code - is full of surprises.
Reworking mbsdiff seems like a lot of effort, and we're lazy, so what else can we do?
mbsdiff itself works on individual files, so for each file within a complete update, the diff of the earlier, or 'from' file is compared to the later, or 'to' file, and the patch is put in the partial update. When you examine the contents of a MAR file, the largest file in there is XUL - libxul.so on Linux, xul.dll on Windows, and XUL on MacOSX. Some more detailed timing shows what we might expect, that this file takes the longest to generate, and takes most of the time shown in the 'partial generation time' graph above.
In the wider context
Let's take a step back to see what we can do with this information. We know that partial updates are:
- Generated for five platforms - Windows 32/64bit, MacOSX and Linux 32/64bit
- Generated for every locale for those five platforms, currently 102 locales.
At first glance this makes it clear that we could save a lot of compute time (and AWS CPU credits!) by reducing this workload. There's one other useful piece of information:
- The original build is US English, other locales take the finished en-US package, and repackage them with the different locales' requirements, and get the packages signed again.
- Partial updates are generated as soon as the complete package for that platform and locale have been signed.
Knowing that en-US builds happen first, this means that if there are any files in the en-US build that are not localised, they will be the same for all locales on that platform. If we cache the results of mbsdiff for en-US, we can save a lot of compute time in the other locales, especially with larger files like libxul.so/xul.dll.
The S3 Cache
Since our workers run in AWS, it's simple enough to add a cache. We can gain temporary S3 credentials through either taskcluster, or through an IAM role attached to the instance. Because other tasks may be using the same instances, we opt for gaining temporary S3 credentials through taskcluster. Some extra scripting in the Docker container lets us work out what the S3 bucket name is from the task's scopes, and how to ask for the credentials with the help of the awesome jq tool:
# auth:aws-s3:read-write:tc-gp-private-1d-us-east-1/releng/mbsdiff-cache/
# -> bucket of tc-gp-private-1d-us-east-1, path of releng/mbsdiff-cache/
# Trailing slash is important, due to prefix permissions in S3.
S3_BUCKET_AND_PATH=$(jq -r '.scopes[] | select(contains ("auth:aws-s3"))' /home/worker/task.json | awk -F: '{print $4}')

if [ -n "${S3_BUCKET_AND_PATH}" ] && getent hosts taskcluster
then
  # Does this parse as we expect?
  S3_PATH=${S3_BUCKET_AND_PATH#*/}
  AWS_BUCKET_NAME=${S3_BUCKET_AND_PATH%/${S3_PATH}*}
  test "${S3_PATH}"
  test "${AWS_BUCKET_NAME}"
  set +x  # Don't echo these.
  secret_url="taskcluster/auth/v1/aws/s3/read-write/${AWS_BUCKET_NAME}/${S3_PATH}"
  AUTH=$(curl "${secret_url}")
  AWS_ACCESS_KEY_ID=$(echo "${AUTH}" | jq -r '.credentials.accessKeyId')
  AWS_SECRET_ACCESS_KEY=$(echo "${AUTH}" | jq -r '.credentials.secretAccessKey')
  AWS_SESSION_TOKEN=$(echo "${AUTH}" | jq -r '.credentials.sessionToken')
  export AWS_ACCESS_KEY_ID
  export AWS_SECRET_ACCESS_KEY
  export AWS_SESSION_TOKEN
  AUTH=
fi
Before each call to mbsdiff, we get a SHA hash of the two files we're about to diff, and check to see if there is an object in S3 keyed on those hashes and the filename. If there is, we can download it and use that instead. If it's not there, we store it in S3 after computing the diff. This means that the en-US partials build takes longer, but saves the other locales work.
Network I/O is not free, and neither is computing the SHA hash, so there's a possibility for more optimisation by only doing this on files above a certain size. For the smallest files, we've traded CPU time for network latency. Have we saved time overall?
It doesn't look easy to see. Let's have a look at the full task durations, to see if that's clearer. Since we don't have historical data for this in Datadog, we import the data into plot.ly and produce a graph there.
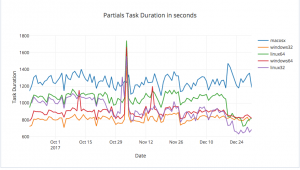
This is much clearer, even though it's an aggregate value over four partials generations. The end of the graph shows a marked drop in task duration. We expect spikes, because en-US still takes the original length of time - in fact, a bit longer because now it has to upload patches. It looks like MacOSX takes even longer now. Are there cache misses? We need to add more metrics collection to find out. It looks like we have saved a lot of effort for the other platforms.
Adding to the table from earlier, we can compare the average task times
| Platform | Pre-caching Duration | Post-caching Duration |
|---|---|---|
| windows2012-64 | 14m53s | 14m00s |
| windows2012-32 | 13m41s | 13m03 |
| linux64 | 17m11s | 13m25s |
| linux32 | 13m18s | 10m53s |
| OSX | 19m14s | 22m37s |
That MacOSX change definitely needs investigating. A good place to start would be a more sensible use of caching, so it's only done for larger files. We also need to know our cache hit rate.
In part 2, we will work on making some of the IO in the partials task asynchronous, and afterwards look into what's happening with the cache.